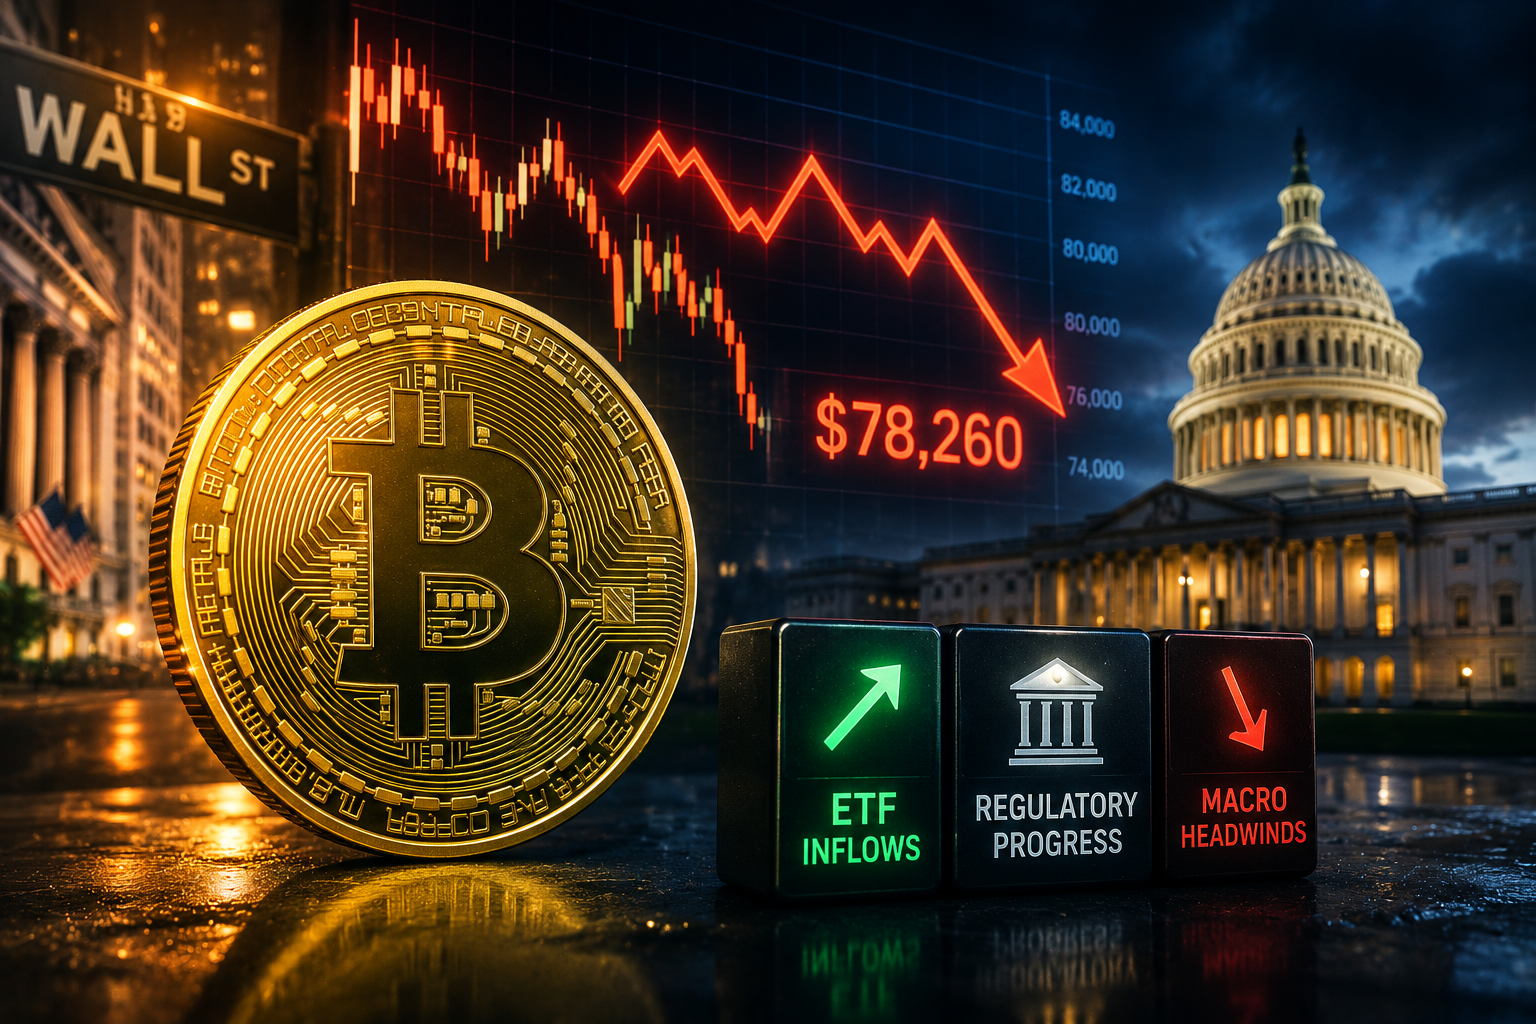
Bitcoin is trading around $78,260 to close out the week, down roughly 0.9% over the past 24 hours and well off the $81,000 level it briefly reclaimed on Friday. For anyone just starting to follow this market, the past seven days have been a useful primer in how crypto now actually trades: it is no longer a fringe asset moving on its own clock. It moves with bond yields, equity sentiment, and what is happening in Washington — and this week all three pulled in opposite directions.
The numbers, in plain English
Bitcoin’s market capitalization — the total dollar value of every coin in circulation — sits at about $1.57 trillion. To put that in perspective, that is larger than the market cap of every U.S. public company except a small handful of tech giants. The weekly performance was choppy: Bitcoin opened above $81,000 on Friday, slipped through Saturday alongside a sharp sell-off in U.S. stocks, and is finishing the weekend at the lower end of that range.
Ethereum, the second-largest cryptocurrency, is having a noticeably worse year. It opened Friday at $2,282 and remains roughly flat for the week. More telling for serious market watchers, the ETH/BTC ratio — a simple measure of how much Bitcoin one Ether is worth — recently hit a ten-month low. In plain terms: even when crypto goes up, Bitcoin is going up faster.
If you are new to this market, the takeaway is not that Ethereum is broken. It is that the two largest digital assets are increasingly trading as different things, for different reasons, by different buyers.
What pushed prices around this week
Three forces shaped the tape.
Spot ETF inflows kept showing up. A spot Bitcoin ETF (exchange-traded fund) is a stock-market product that holds real Bitcoin and trades like any other share. For traditional investors, it is the easiest way to get crypto exposure without dealing with wallets or exchanges. In the first week of May, U.S. spot Bitcoin ETFs absorbed roughly $1.25 billion in net inflows, and the asset class recently ran a nine-day streak that pulled in about $2.7 billion. Cumulative net inflows since these products launched in 2024 have now passed $59.7 billion. BlackRock’s IBIT alone holds about two-thirds of total spot ETF assets.
For a beginner, the practical translation is this: the same large financial institutions that buy Treasury bonds and tech stocks are now buying Bitcoin in size, through the same channels they use for everything else. That is the single most important structural change in this market in the past two years.
Washington moved closer to a real rulebook. On May 14, the Senate Banking Committee voted 15-9 to advance the Digital Asset Market Clarity Act — usually shortened to the “CLARITY Act” — to the full Senate. Two Democrats joined every Republican on the panel. The bill would, for the first time, settle the long-running question of which U.S. regulator (the SEC or the CFTC) oversees which digital assets. It is not law yet. It still needs to be reconciled with a Senate Agriculture Committee version, clear sixty votes on the Senate floor, and pass the House. Senate sponsors have indicated they want it done before August.
Regulatory clarity is one of the most frequently cited reasons institutional investors have stayed on the sidelines. If the CLARITY Act becomes law in something close to its current form, the rules of the road get clearer, and large allocators tend to act on clarity.
Macro turned briefly ugly. Overnight on Friday, a wave of forced selling — called a “long-skewed liquidation cascade,” which simply means traders who had borrowed to bet on higher prices were force-sold when prices dropped — rippled through every major token. The trigger was outside crypto entirely: a global sell-off in government bonds and the worst session for U.S. stocks since March. Crypto did not cause it; crypto reacted to it. For new participants, that is a critical point. The “Bitcoin is uncorrelated” narrative has aged poorly. On bad days for risk assets, Bitcoin generally has bad days too.
Why Ethereum is lagging
The institutional money flowing through ETFs is overwhelmingly going to Bitcoin. Spot Ethereum ETFs exist, and they have pulled in roughly $170 million since the start of May — real money, but a fraction of what Bitcoin is absorbing. The structural demand floor that has kept Bitcoin defending the $80,000 level simply is not there for ETH yet.
This is worth understanding because it tells you something about how this market has matured. For most of crypto’s history, the two assets moved together. That is changing. Bitcoin is increasingly treated as a macro asset, like digital gold. Ethereum is treated as a technology bet on a specific platform. They are no longer the same trade.
What it means if you are just starting out
Three things are worth absorbing from a week like this.
First, the calendar matters more than it used to. Macro events — central bank meetings, inflation reports, regulatory votes — now move crypto prices the way they move equities. If you are paying attention to a weekly chart and ignoring the Federal Reserve calendar, you are missing the picture.
Second, the source of the buying matters. ETF inflows are sticky. Leveraged retail buying is not. Sustainable rallies in this market are increasingly built on the former.
Third, do not confuse a strong week of headlines with a guaranteed direction. Bitcoin is up sharply year-over-year, but the path is not a straight line. Friday’s $81,000 print and Sunday’s $78,000 are five days apart.
What to watch next week
The Senate floor schedule on the CLARITY Act is the big political variable. ETF flow data, which is reported daily, will tell us whether institutional buying held up through the bond market wobble. And the broader macro tape — bond yields, the dollar, and any updates on the Iran ceasefire — will continue to be the gravity that crypto trades against.
A flat week is not nothing. In this market, sometimes it is a feature.